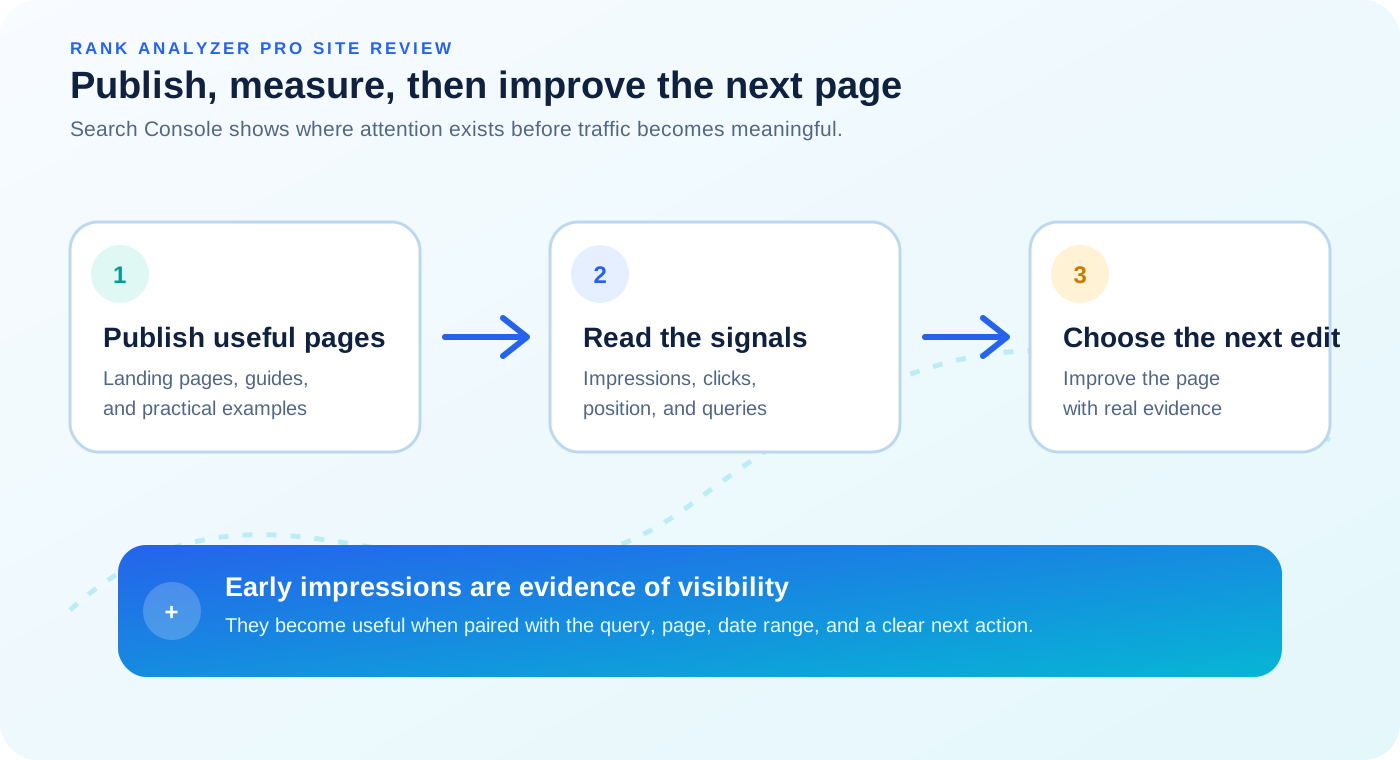
This is a page-level case study from one Search Console snapshot. It records what was visible in the data we reviewed, the content changes that preceded it, and the limits of the comparison. The numbers below are not a controlled experiment and they do not prove that a particular article caused a particular impression. They show what we know now and how we will use it to choose the next test.
The result in one sentence
The content created early search visibility, but not meaningful traffic yet: the seven reported page rows contained 1,120 impressions and 9 clicks, with a simple impression-weighted average position of about 64.7 across those rows.
That total is calculated from the supplied page rows, not presented as the full property's total. Search Console's page and property aggregations can differ, so the row-level sample must stay labeled as a sample.
What we changed
The work focused on clear search intents around app keyword research and visibility. We added or expanded product pages for the main workflows, then built supporting articles around questions that developers and ASO teams ask before changing a listing or tracking a keyword.
| Content group | Pages or topics | Recorded date |
|---|---|---|
| Core product pages | App keyword tracking, App Store tracking, Google Play tracking, competitor tracking, and ASO rank tracking | 2026-07-22 sitemap update |
| Measurement guides | How to measure ASO changes after updating an app listing; iOS vs Google Play ASO | 2026-09-09 |
| Keyword strategy guide | App keyword volume vs difficulty | 2026-09-10 |
| Visibility guide | Why is my app not ranking for keywords? | 2026-09-11 |
| Supporting guides | Keyword discovery, ranking drops, country differences, tracking quantity, and competitor overlap | Earlier publishing cycle |
The dates above come from the site's publishing and sitemap records. They describe when pages were recorded or updated; they do not provide the Search Console comparison period. That distinction matters when trying to connect content publication with search performance.
The page-level Search Console snapshot
The following values are the top-page rows supplied for this review. Clicks and impressions are counts for the selected Search Console period. Average position is a page-level metric for that period, not a permanent position for the page or a single target keyword.
| Page | Clicks | Impressions | Average position |
|---|---|---|---|
| Homepage | 6 | 114 | 46.5 |
| App keyword tracking tool | 3 | 365 | 71.1 |
| App Store keyword rank tracker | 0 | 278 | 63.2 |
| Competitor app keyword tracker | 0 | 217 | 73.6 |
| Google Play keyword rank tracker | 0 | 114 | 59.5 |
| ASO rank tracker | 0 | 31 | 27.6 |
| Discover high-potential app keywords | 0 | 1 | 2.0 |
Across these seven rows, the arithmetic is 9 clicks divided by 1,120 impressions, or about 0.8% click-through rate. The impression-weighted position is about 64.7. Those calculations help describe the sample, but they should not replace the complete Performance report. Pages outside the supplied rows, query grouping, canonicalization, country, device, and the selected date range can change the interpretation.
What the numbers actually tell us
1. The site has visibility before it has reliable traffic
Impressions mean that Google showed a result from the site for searches in the selected data set. They are an early visibility signal. The product pages receiving hundreds of impressions are being considered for relevant searches, but average positions around 59 to 74 make consistent clicks difficult. The immediate job is to improve the pages that already have a search foothold rather than assume the whole content strategy needs to be replaced.
2. The app keyword tracking page is the clearest optimization candidate
The app keyword tracking tool page had the largest impression count among the product pages in the snapshot: 365 impressions and 3 clicks. Its average position was 71.1. That combination suggests a page with enough visibility to learn from and a large gap between being shown and being chosen.
The next review should inspect the page's actual queries and snippets. If the queries match the intended app keyword tracking topic, improve the opening answer, title wording, supporting proof, and internal links. If the queries are broad or mismatched, the page needs tighter intent alignment before more copy is added.
3. The ASO rank tracker page has a promising but small sample
The ASO rank tracker page showed an average position of 27.6, the strongest product-page position in the supplied rows, but only 31 impressions and no clicks. That is a useful signal, not a victory. A small number of impressions can produce an unstable average, and the page needs more query data before we decide whether the topic has durable demand.
4. The blog result cannot be generalized from one impression
The high-potential keyword discovery article appeared with 1 impression and an average position of 2.0 in the supplied row. One impression is too little evidence to evaluate the article's performance. It may reflect a very specific query, a fresh page, or a result type with different visibility behavior. We should keep the page useful and wait for a larger sample before drawing a conclusion.
5. Zero clicks does not mean zero value, but it does define the next problem
The five product pages with zero clicks still received impressions. That means the next problem is partly selection and page position, not only discovery. We need to know which queries produced those impressions, whether the page title answers them directly, and whether the result is competing with a more specific page from the same site. Without query-level data, changing copy would be guesswork.
Why average position must be read carefully
Search Console's average position is not the same as checking one keyword at one moment. It aggregates the positions recorded for a page's impressions over the selected period. The result can include multiple queries, countries, devices, search features, and different pages from the same property. A page at position 46.5 has not necessarily ranked at exactly 46 or 47 for its main topic.
Google's explanation of clicks, impressions, and position describes how these metrics are counted. The Search Console Performance report documentation also explains how to switch between pages, queries, countries, devices, and dates. Those dimensions are necessary before deciding that one page is ranking or failing for one exact query.
Use Search Console for site traffic and rank tracking for app visibility
Search Console measures how the Rank Analyzer Pro website appears in Google Search. It does not tell us where a mobile app ranks inside the App Store or Google Play. Rank Analyzer Pro's app keyword workflow addresses that separate question by keeping an app, store, country, keyword, and observation together.
Explore app keyword trackingWhat we will improve next
The next work should follow the evidence in the table rather than add another broad article. We will use the page and query views to make one focused improvement, then compare the same page over a defined period.
- Export query-level data.For each product page, record the queries, impressions, clicks, click-through rate, average position, country, and device for a stated date range.
- Prioritize pages with enough impressions.Start with the app keyword tracking and App Store pages because they have more observations than the newer blog row.
- Match the page to the actual query.Rewrite only where the search intent and page promise do not line up. Keep terminology accurate and avoid adding keywords that the page does not support.
- Strengthen the internal path.Link the relevant guides to the matching product page with descriptive anchor text, then link back to the guide when it provides the deeper explanation.
- Improve the result before expanding the topic set.Review the title, description, opening answer, headings, examples, and structured data as one page experience.
- Measure one change at a time.Keep the next comparison window and page scope stable so a movement can be interpreted.
What we will not claim from this snapshot
- It does not prove that publishing the content caused the reported impressions.
- It does not show the site's complete traffic because only selected page rows were supplied.
- It does not identify the exact queries, countries, devices, or Search Console date range.
- It does not prove that a page at position 60 will stay there or that it cannot improve.
- It does not show signups, activation, product usage, or customers.
- It does not tell us whether backlinks, brand demand, technical performance, or another external factor contributed to the result.
Stating these limits makes the case study more useful. A small data set can still guide the next test when the claims stay proportional to the evidence.
How this changes our content strategy
We will keep the existing articles, but we will pause the pattern of publishing general troubleshooting pages that repeat the same checklist. Each future page should answer one specific search question and lead to one clear outcome. When we have a real app data set with permission to publish it, we will add a documented app-ranking case study with exact stores, countries, dates, observations, and unsuccessful results.
Until then, this site case study is the honest version of the story: content has begun to earn visibility, the pages are not yet attracting much traffic, and the next gain is more likely to come from improving pages with existing impressions than from producing a larger pile of similar articles. That approach also follows Google's guidance to create helpful, reliable, people-first content with substantial value for the reader.
FAQ
Did publishing ASO content immediately increase traffic?
The reviewed page snapshot shows early visibility but limited traffic: seven reported page rows produced nine clicks and 1,120 impressions in total. That is a baseline, not proof that publishing the content caused the traffic.
What does an average position of 60 mean in Search Console?
It is the average position of the site's topmost result for impressions attributed to that page and period. It is not one fixed rank for one keyword, and it should be read with queries, impressions, clicks, and the selected date range.
Which ASO page should be improved first?
Start with a page that has meaningful impressions and a realistic improvement opportunity. In this snapshot, the app keyword tracking tool had the most impressions among the product pages, while the ASO rank tracker had the strongest average position but a small impression sample.
How should I measure content performance in Search Console?
Compare the same pages across a defined date range using queries, clicks, impressions, click-through rate, average position, country, and device. Separate indexing and visibility from traffic and conversion, and avoid changing several page variables before the next comparison.
Conclusion
Publishing ASO content gave Rank Analyzer Pro an early search footprint, but it has not produced meaningful traffic yet. The useful finding is where the next work belongs: product pages with impressions, especially the app keyword tracking page, need query-level review and focused improvements. We will measure those changes over a defined period and publish the next result with the same level of transparency.
If you are building an app and want to understand the separate problem of App Store or Google Play visibility, see how app keyword tracking works by store and country.