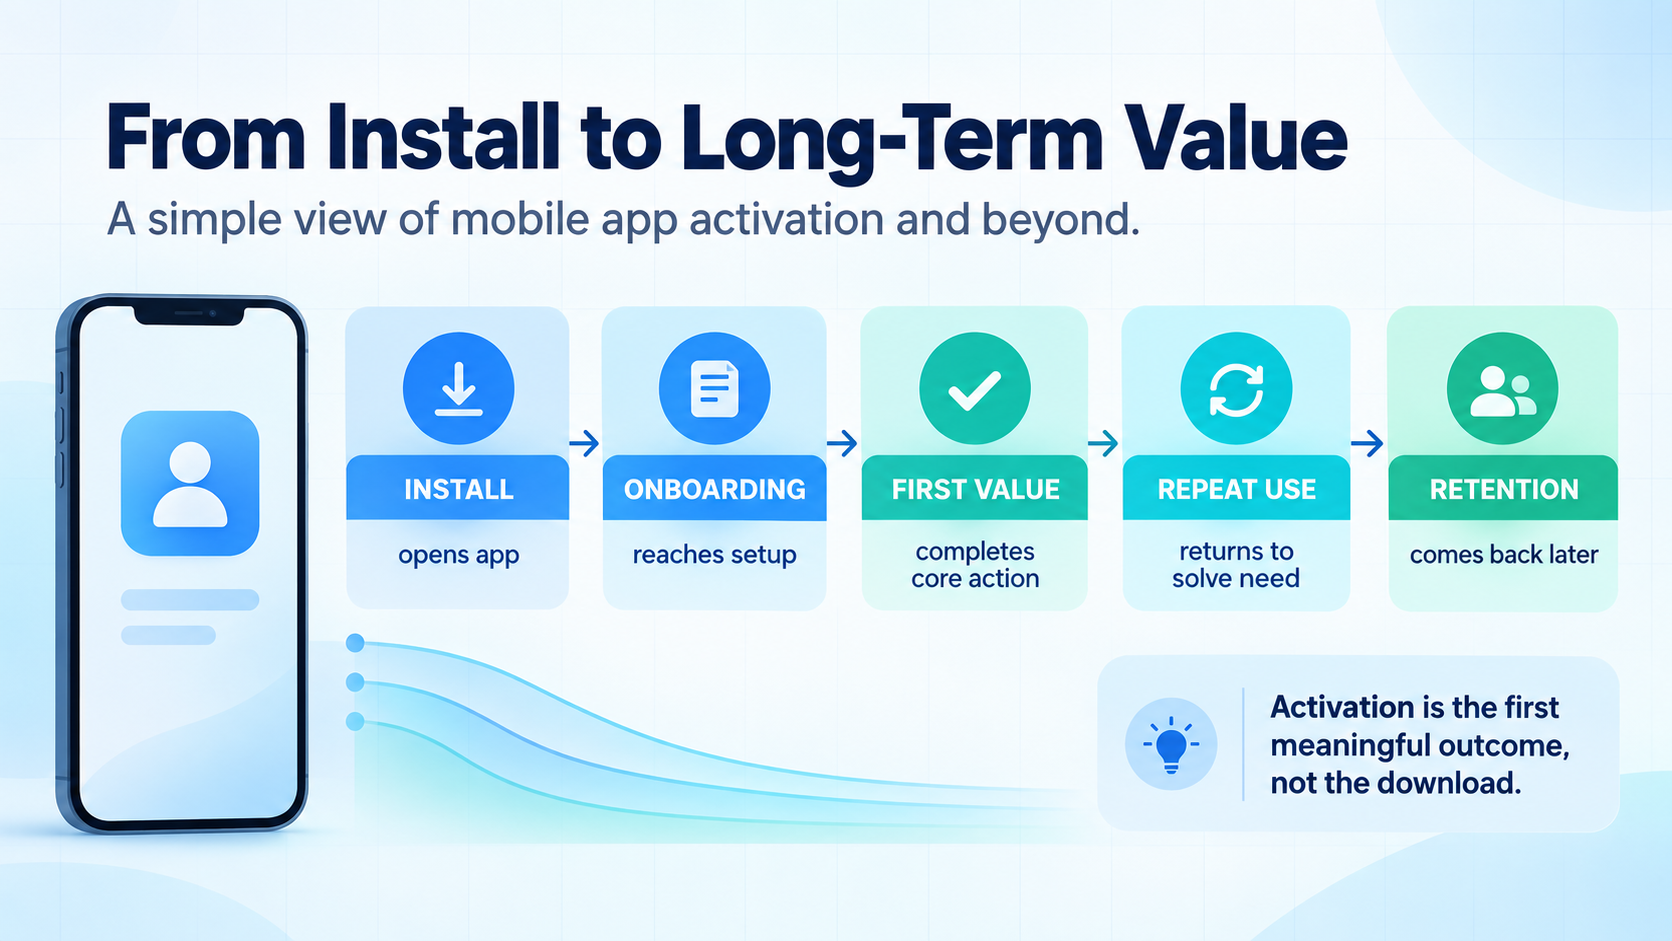
Activation is not one universal event. A budgeting app might activate a user when they create a first budget with real categories. A language app might use a completed first lesson. A photo editor might use the first exported image. The useful definition is specific to the promise your app makes, not to the screen where the user happens to be.
This guide shows how to choose that definition, instrument the surrounding steps, and read the result without confusing acquisition, activation, engagement, and retention. For the pre-install side of the journey, pair it with the pre-marketing measurement checklist and the impressions-to-installs diagnosis.
Measure the first useful outcome
Choose one action that proves a new user understood the product and received its first benefit. Track the steps that lead to it, the time it takes, and whether activated users return more often than users who never reach it.
Activation is later than an install
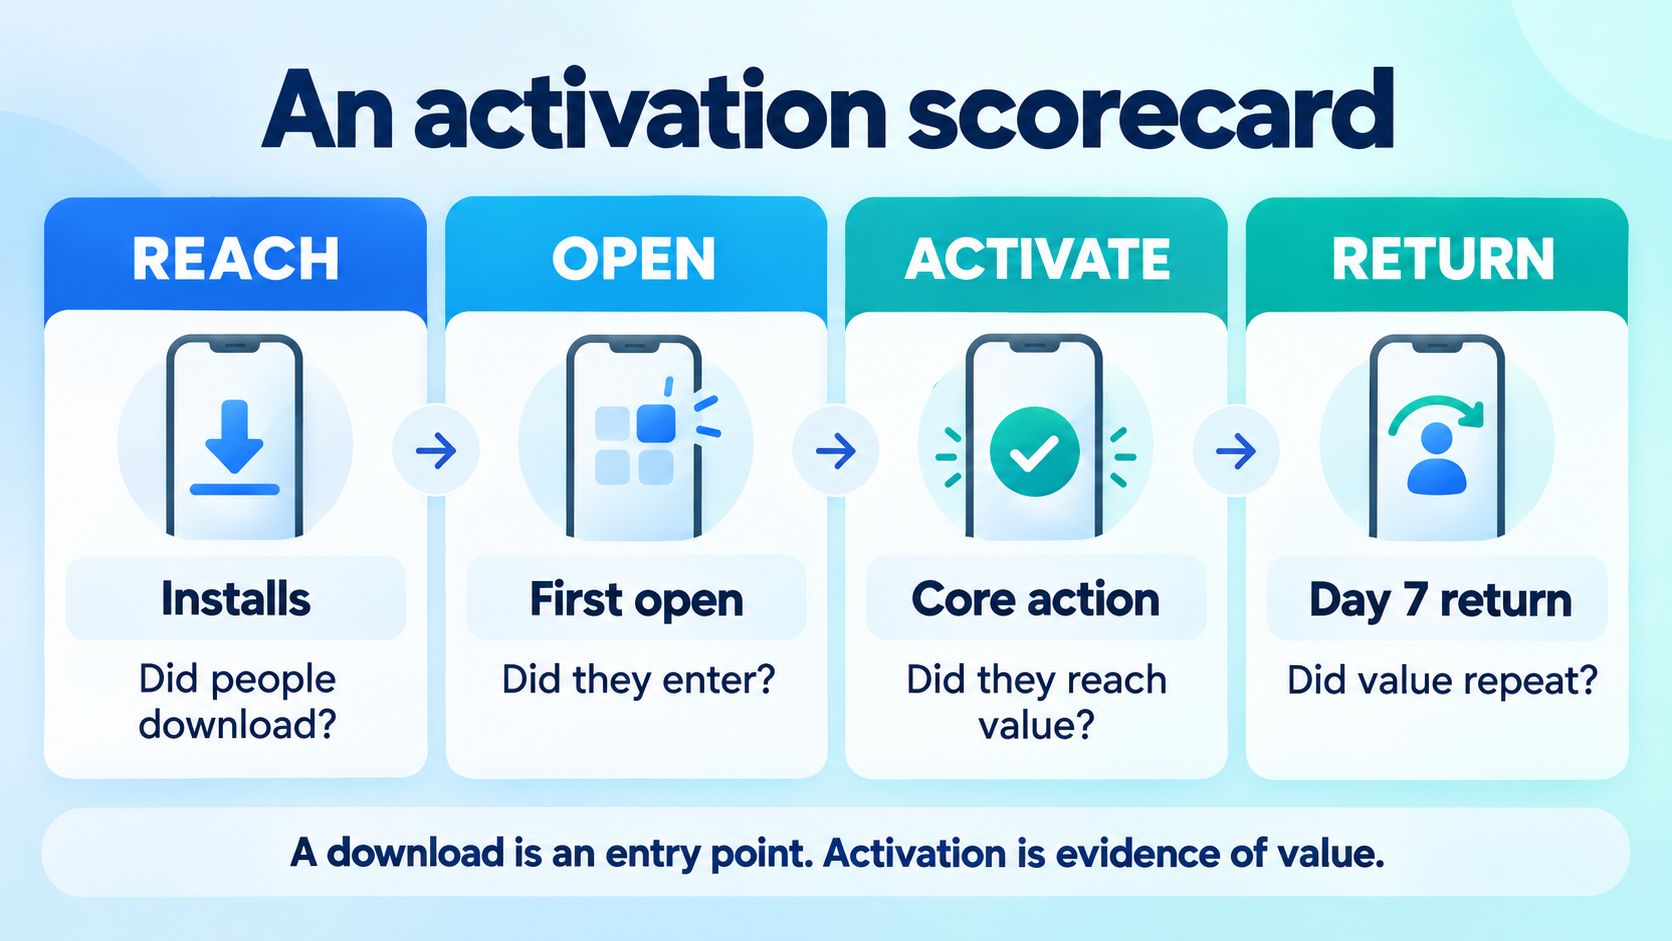
Each early metric answers a different question. An install measures acquisition. A first open measures entry. Onboarding completion measures progress through setup. Activation measures the first useful outcome. Retention measures whether the user comes back or repeats the job later. Treating them as interchangeable hides the point where the experience is losing people.
| Metric | What it tells you | What it cannot prove |
|---|---|---|
| Install | The store or campaign generated a download. | That the user opened the app or understood its value. |
| First open | The app launched after installation. | That setup was completed or the core job was attempted. |
| Onboarding completion | The user reached the end of the required setup path. | That the user received a useful result. |
| Activation | The user completed the product's first meaningful outcome. | That they will keep returning indefinitely. |
| Retention | The user returned or repeated a defined behavior in a later period. | Why the user returned unless the event context is instrumented. |
This separation also prevents bad decisions. If installs are healthy but first opens are low, investigate delivery, attribution, or the quality of the install signal. If first opens are healthy but activation is weak, improve the first-run path before buying more traffic. If activation is strong but later retention is weak, the first experience may be promising more than the recurring product can deliver.
How to define a useful activation event
Write the activation definition in one sentence before opening the analytics console. It should describe a user outcome, not a button tap or page view. A strong definition contains four parts:
- Who.Usually a new user or a clearly defined cohort, not every user mixed together.
- Action.The core job that demonstrates the app's primary value.
- Quality condition.Any requirement that makes the action meaningful, such as a saved result, completed lesson, or successful export.
- Time window.A stated period such as the first session, first 24 hours, or first seven days.
For example: “A new user who creates a first project and successfully exports one result within seven days is activated.” That is more useful than “the user visited the editor,” because it connects the event to an outcome. If your app has several equally important jobs, choose a primary activation event and keep secondary milestones separate rather than blending them into an optimistic score.
Six metrics that explain the post-install journey
| Metric | Why track it | Useful follow-up |
|---|---|---|
| First open rate | Shows how many acquired users enter the app. | Compare by store, country, campaign, and app version. |
| Onboarding completion | Shows whether setup creates friction before value. | Find the step where users exit or skip. |
| Time to first value | Shows how long users wait for the promised benefit. | Use median and percentiles, not only an average. |
| Activation rate | Shows the share of new users reaching the chosen outcome. | State the cohort and time window beside the rate. |
| Repeat-value rate | Shows whether activated users perform the core job again. | Compare activated and non-activated cohorts. |
| D1, D7, or D30 retention | Shows whether users return during a defined period. | Use the window that matches the app's natural usage cycle. |
You do not need to publish every number in a weekly meeting. Use the smallest set that explains a current decision. A productivity app used several times each day may learn quickly from first-session activation and Day 7 retention. A tax or travel app with seasonal use may need a longer window and a different repeat-value definition.
Pick activation based on the app's real job
The right event changes with the product. Use the examples below as prompts, not as a checklist to copy blindly:
| App type | Weak proxy | Stronger activation outcome |
|---|---|---|
| Notes or writing | Opened the editor | Created and saved a first note |
| Fitness | Viewed a workout | Completed the first workout or logged a completed set |
| Finance | Viewed the dashboard | Created a budget, imported data, or completed the app's first financial task |
| Learning | Opened a lesson | Finished a lesson and demonstrated the intended practice |
| Creator tool | Opened the canvas | Exported or shared a completed result |
| Marketplace | Searched for an item | Completed a qualified action such as saving, contacting, or purchasing |
A search, view, or open can still be useful as an intermediate event. It becomes a problem only when it is treated as proof of value. Keep the intermediate action so you can locate friction, then reserve activation for the outcome that matters.
Instrument the path with a small event contract
For teams using Firebase Analytics, the best event plan is usually a small contract around the product journey. Firebase provides automatically collected events and supports recommended and custom events, but the platform cannot decide what your app's first value moment is. The official Firebase Analytics overview is the right starting point for platform setup and capabilities.
A lean activation contract might include:
first_open: use the platform's collected signal for entry when it fits your implementation.onboarding_completed: fire after required setup reaches a usable state.first_value_reached: fire after the first meaningful outcome is confirmed.core_action_completed: fire when the recurring product job succeeds.return_value_action: use a product-specific repeat event instead of counting any app open as value.
Keep names stable when the interface changes. Use bounded parameters such as app version, feature area, plan, country, or content type when they answer a real comparison question. Do not put raw messages, email addresses, payment details, search text, or unlimited user-generated content into event parameters. The Firebase event documentation explains how to log events and parameters; your product and privacy requirements should determine which ones belong in production.
Validate instrumentation before trusting the report
A zero activation rate can mean the product is failing, or it can mean the event never fired. Validate the implementation on a known test device before interpreting a new release. Firebase DebugView is designed to inspect collected events during development, while normal reports may be delayed or aggregated.
- Use a repeatable test account.Start from a clean state and record the expected path.
- Trigger each milestone once.Check that the event fires after success, not merely after a tap or optimistic UI state.
- Inspect parameters.Confirm names, values, platform differences, and app version context.
- Test failure paths.Make sure a cancelled, rejected, or failed action does not count as activation.
- Remove debug traffic from decisions.Keep test data out of production conclusions and document the release where the contract changed.
When an event suddenly drops to zero after a release, check the implementation and consent state before redesigning onboarding. A renamed event, a changed trigger, or a parameter rejected by the SDK can look like a product regression in a dashboard.
Read activation together with retention
Activation is an early milestone, not a final health score. A user who completes a first workout may never return. A user who skips onboarding may still discover value later. Compare cohorts, but do not assume activation automatically causes retention unless the data supports that relationship.
Start with an activation cohort and a comparison cohort:
- Users who completed the activation event within the chosen window.
- Users who entered the app but did not complete it in the same window.
- Return or repeat-value behavior for both groups at a consistent later date.
- Segments such as app version, acquisition source, store, country, or plan when the sample is large enough.
Use the retention window that matches natural usage. A daily planner and a tax-filing app should not be judged by the same return interval. The Google Analytics retention overview explains cohort retention reporting; your team still needs to choose the behavior that represents a meaningful return for the product.
Visibility explains entry, not value
When you change store metadata or promotion, record that date separately from app-release and analytics changes. Rank Analyzer Pro can help track app keyword visibility by store and country; Firebase can then show what happened after users entered the app. Keeping those stages separate makes the diagnosis more credible.
Use the pattern, not one percentage
| Observed pattern | Likely question | Next investigation |
|---|---|---|
| Many installs, few first opens | Did the acquisition signal or delivery promise match reality? | Check attribution, platform reporting, app startup, and campaign quality. |
| Many first opens, few activations | Where does the first-run experience block value? | Review onboarding steps, permissions, setup requirements, and time to first value. |
| Strong activation, weak return | Was the first result useful but not recurring? | Compare repeat-value actions, reminders, content supply, and the natural usage cycle. |
| Strong return, weak revenue | Is value present but monetization poorly timed or understood? | Inspect paywall exposure, plan fit, pricing, billing errors, and trial-to-paid behavior. |
| Activation suddenly falls to zero | Did the product change, or did measurement break? | Check release notes, event names, DebugView, consent behavior, and report latency. |
These are investigation paths, not diagnoses. Segmenting too aggressively can turn a small sample into a confident-looking but unstable percentage. Always show counts, cohort dates, and the exact event definition next to the rate.
A seven-day activation review
You can establish a useful baseline without building a large data warehouse:
- Day 1: write the promise.Describe what a new user should accomplish and select one primary activation outcome.
- Day 2: map the path.List install, first open, setup, first value, repeat action, and the points where the app can fail.
- Day 3: audit events.Remove duplicates, define parameters, and confirm that completion events fire after successful outcomes.
- Day 4: test the build.Use DebugView or the platform's equivalent to verify the path on iOS and Android where behavior differs.
- Day 5: create one cohort view.Compare new users who activate with users who do not, using the same acquisition period.
- Day 6: inspect the weak step.Choose one friction point instead of changing onboarding, pricing, and store messaging at once.
- Day 7: record the baseline.Save the event definition, counts, window, app version, and next experiment so later changes have context.
Privacy and interpretation guardrails
Activation analytics should explain product behavior without becoming a copy of the user's private data. Use an approved identifier policy, collect only parameters that answer a defined question, and review consent, retention, deletion, and access requirements for your markets. Do not use a raw email address, payment detail, message content, or sensitive record as an analytics parameter just because it is available in the app.
Also avoid treating a higher activation percentage as automatically better. If the event definition becomes easier, the rate may rise while real value falls. Keep the trigger stable during a comparison, document any change, and include the number of users behind the percentage. Good measurement makes uncertainty visible instead of hiding it.
FAQ
What is mobile app activation?
Mobile app activation is the point at which a new user completes a meaningful action that demonstrates the app's core value. It is usually later than an install or first open, and the exact action depends on the product.
What activation metrics should a mobile app track?
Start with first open, onboarding completion, time to first value, the first core action, activation rate, and a repeat-value event. Add retention and revenue milestones when they answer a specific product question.
How do you calculate mobile app activation rate?
Divide the number of new users who complete your defined activation action within a chosen time window by the number of new users in the same cohort and window. State the activation definition and time window beside the percentage.
Is app activation the same as app retention?
No. Activation shows that a new user reached an early value moment. Retention shows whether users return or repeat a valuable behavior later. Activation can predict retention, but it does not replace cohort retention analysis.
Conclusion
The most useful post-install metric is not the one that looks impressive in a dashboard. It is the one that tells you whether a new user reached the app's promised value, how long that took, and whether the behavior continued. Define activation around a real outcome, instrument the path with a small event contract, validate the data, and compare it with retention in the correct usage window.
Once the baseline is clear, you can improve one stage at a time. Use the Firebase event planning guide for a lean taxonomy, then keep acquisition context separate with the impressions-to-installs framework.