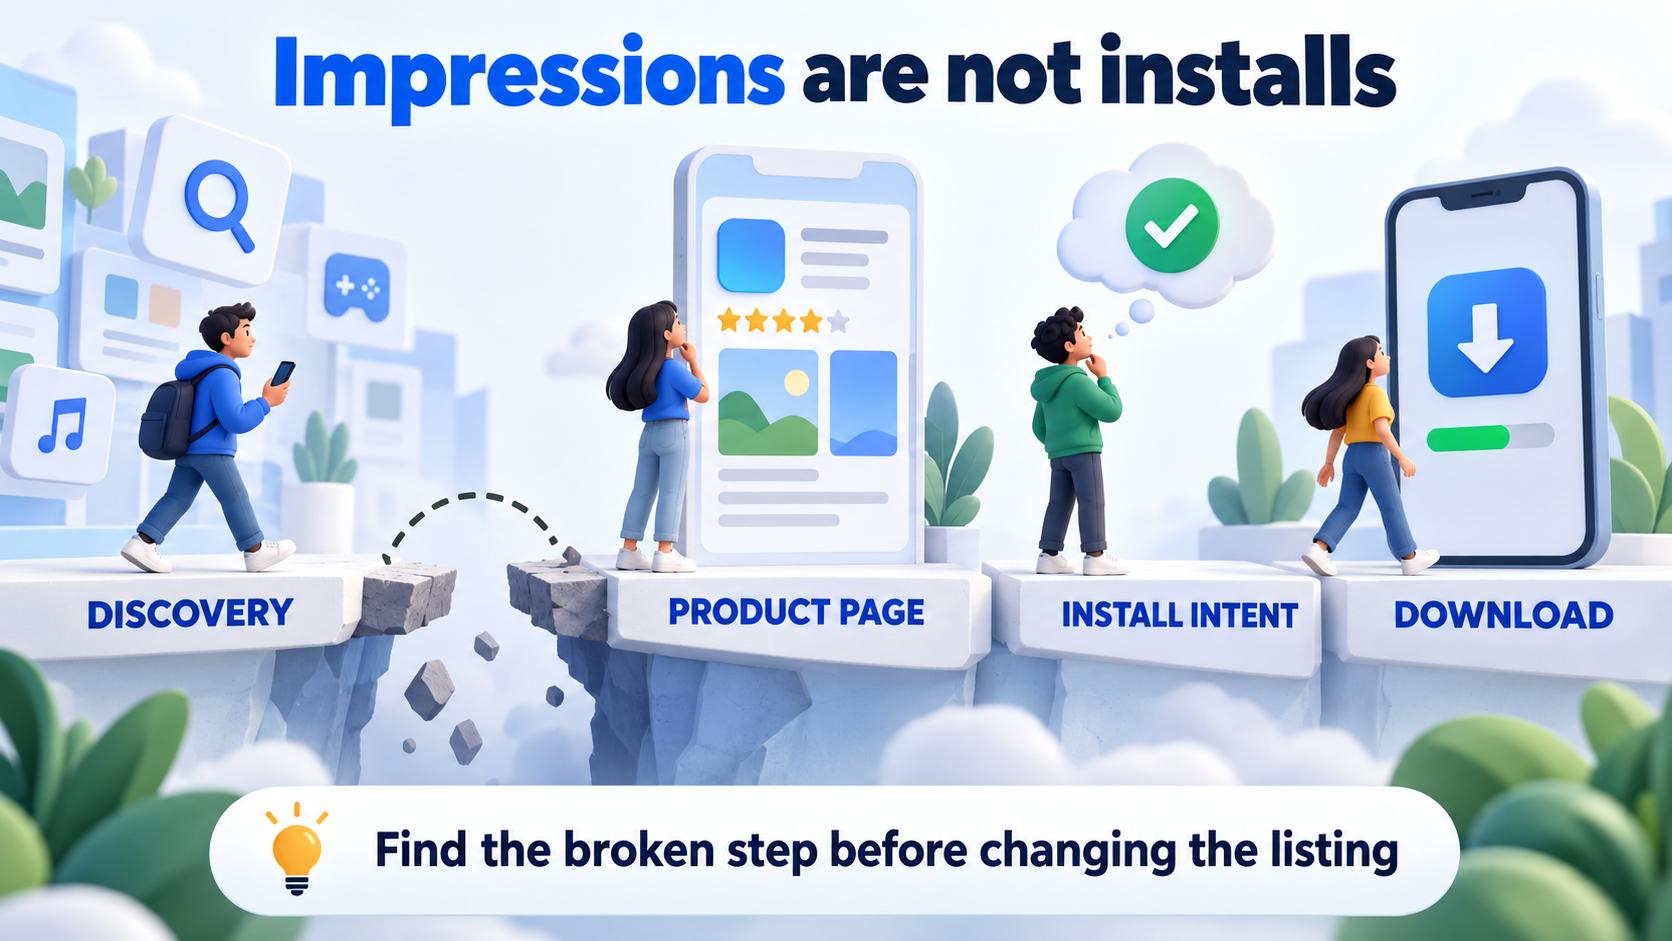
Where does the user stop moving?
Do not ask only, “Why are installs low?” Ask whether the problem is reach, tap interest, product-page conversion, or early product value. Each answer leads to a different action.
First, separate impressions from installs
App stores use several acquisition metrics that describe different moments. Apple defines impressions as times an app was viewed on App Store surfaces, while product page views record visits to the product page and conversion rate relates downloads and pre-orders to unique device impressions. The exact names and formulas differ by platform, so do not combine App Store Connect and Google Play numbers as if they were identical.
Start with the official definitions for App Store Connect metrics and the Google Play acquisition reports. Then write down the closest comparable sequence for your own store and source:
| Stage | What it tells you | Question to ask |
|---|---|---|
| Impression | The app was shown in a discovery surface. | Are the people seeing it relevant to the app? |
| Tap or page view | The result earned enough interest to open. | Does the listing promise match the discovery context? |
| Install | The product page created enough confidence to download. | Does the page explain the first useful outcome? |
| First value | The new user reached a meaningful in-app action. | Did the installed experience keep the promise? |
Case 1: high impressions, few taps
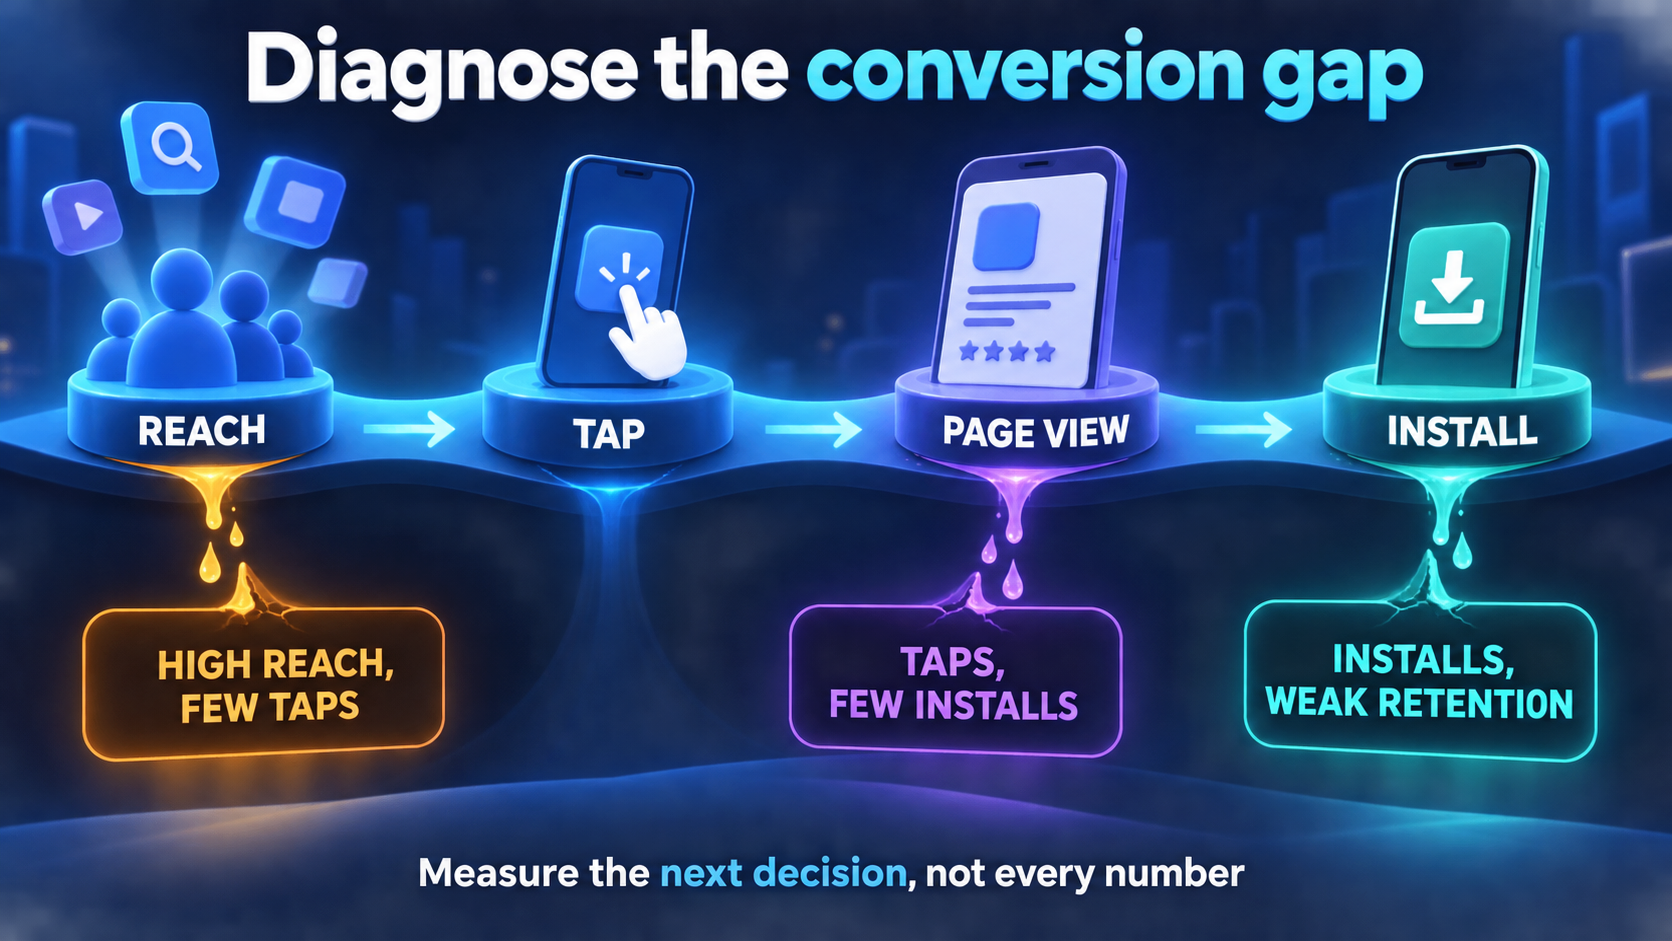
When the app is shown often but rarely earns a tap, the problem is usually before the product page. The query, category placement, icon, title, or first visual signal may not make the app feel relevant to the person who sees it. A high impression count can even be misleading when the app is appearing for broad searches that are only loosely related to the product.
Check discovery and relevance
- Break the result down by store, country, acquisition source, and time window.
- Compare the search language with the exact problem your app solves.
- Check whether the title and icon communicate the category in a few seconds.
- Look for broad terms that create reach but attract the wrong audience.
- Review whether a recent metadata change changed which searches expose the app.
For organic discovery, a rank observation adds context to reach: an app may receive impressions because it is visible for a broad term without being a strong answer for that term. Review how demand, difficulty, relevance, and rank work together instead of treating volume as proof of acquisition quality.
Case 2: many page views, few installs
This is a different problem. The user has already shown enough interest to open the page, but the page is not creating enough confidence to download. Common causes include a promise that is vague, screenshots that show features instead of outcomes, a rating or review pattern that creates doubt, an unexpected price, or a mismatch between the discovery message and the page.
Improve the first decision, not every asset
Start with the first screen and the first screenshot because those are part of the decision to continue. Make the primary job obvious, show the result a user can expect, and remove claims that the app cannot immediately support. Keep the change narrow enough that the next measurement can teach you something.
Both stores provide ways to test listing treatments. Apple explains how Product Page Optimization can compare alternate icons, screenshots, and app previews. Google Play documents store listing experiments for testing graphics and text. Use those experiments when you have enough comparable traffic to learn from the result, and avoid changing several major elements at once.
Case 3: installs happen, but users do not reach value
A download is an acquisition outcome, not the end of the funnel. If many users install and then disappear, the listing may be doing its job while onboarding, performance, permissions, pricing, or the first-run experience is failing. Changing metadata in this situation can increase traffic without fixing the product experience.
Define one first-value event that represents a real outcome for the app: completing a first project, saving a result, sending a message, finishing a lesson, or another action that shows the user understood the product. Track that event with the rest of a lean taxonomy. The Firebase Analytics event guide explains how to choose activation, repeat-value, and conversion events without logging every tap.
- High installs, low onboarding completion: reduce confusion or unnecessary setup.
- High onboarding completion, low first value: inspect the first task and time to outcome.
- Good first value, weak return: review whether the app solves a recurring problem and gives users a reason to come back.
- Good return, weak paid conversion: test pricing, packaging, and the moment when the upgrade is offered.
Keep visibility in the same diagnosis
If the funnel starts with organic store discovery, Rank Analyzer Pro helps you check app visibility by keyword, store, and country so you can separate a reach problem from a product-page problem. Explore app keyword tracking when you need a repeatable visibility baseline alongside your acquisition metrics.
Build a baseline instead of chasing a universal rate
A single install conversion number is easy to quote and difficult to interpret. Category, store, country, traffic source, paid campaign, season, price, audience intent, and listing maturity can all change the result. A rate that looks weak in one slice may be normal in another, while a blended average can hide a serious problem in a high-value market.
Create a baseline using the same definitions and time window each time. Keep the slices small enough to compare but large enough to avoid reacting to random noise:
| Dimension | Why it matters | Keep consistent |
|---|---|---|
| Store | Listing fields and reporting definitions differ. | Compare App Store with App Store, Google Play with Google Play. |
| Country | Demand, language, competition, and pricing can change. | Keep the same storefront and localization. |
| Source | Organic, paid, web, and referral users have different intent. | Use the same attribution or acquisition grouping. |
| Window | Launches, updates, and campaigns create temporary shifts. | Compare matching dates and note major changes. |
| Outcome | Install, activation, retention, and revenue answer different questions. | Do not call one outcome a substitute for another. |
A practical seven-day diagnosis
- Define the leak.Write the exact pair you are comparing, such as impressions to page views or page views to installs.
- Choose one comparable slice.Start with one store, country, source, and date window instead of a blended global total.
- Check for a recent change.Mark listing updates, price changes, campaigns, app releases, outages, and major competitor movement.
- Measure the next step.If taps are weak, inspect relevance and discovery. If installs are weak, inspect the product page. If retention is weak, inspect first value.
- Change one meaningful variable.Choose the smallest listing or product change that directly addresses the evidence.
- Wait for a comparable window.Do not declare a winner from a few hours of noisy traffic or mix the test with a new campaign.
- Record what failed too.An unsuccessful change narrows the diagnosis and prevents the team from repeating the same assumption.
Before launching paid promotion, use the related pre-promotion measurement checklist to establish visibility, acquisition, activation, retention, and revenue baselines. The goal is not to make every metric rise at once. The goal is to know which metric should move when you make a particular change.
What not to conclude from high impressions
- High impressions do not prove high intent. The app may be shown for broad or loosely related searches.
- Low installs do not automatically mean low visibility. The leak may be on the product page or in the first-run experience.
- One weak day does not prove a failed listing. Check the same market and source across a meaningful window.
- A good blended rate does not prove every market works. Segment by store and country before changing a localized listing.
- A ranking change does not explain conversion by itself. Pair visibility observations with page views, downloads, and post-install events.
Conclusion
Impressions are useful because they show that an acquisition opportunity exists. They are not evidence that the opportunity is relevant, persuasive, or valuable after installation. Separate discovery, page interest, install conversion, and first value. Then build a consistent baseline, make one focused change, and compare the same slice again.
The best diagnosis is not “we need more installs.” It is “users stop between these two steps, in this store and country, during this window, after this change.” That level of precision turns a worrying number into an actionable product decision.